The Elastic Stack — formerly known as the ELK Stack — is a collection of open-source software produced by Elastic which allows you to search, analyze, and visualize logs generated from any source in any format, a practice known as centralized logging. Centralized logging can be very useful when attempting to identify problems with your servers or applications, as it allows you to search through all of your logs in a single place. It's also useful because it allows you to identify issues that span multiple servers by correlating their logs during a specific time frame.
The Elastic Stack has four main components:
- Elasticsearch: a distributed RESTful search engine which stores all of the collected data.
- Logstash: the data processing component of the Elastic Stack which sends incoming data to Elasticsearch.
- Kibana: a web interface for searching and visualizing logs.
- Beats: lightweight, single-purpose data shippers that can send data from hundreds or thousands of machines to either Logstash or Elasticsearch.
In this tutorial, you will install the Elastic Stack on a CentOS 7 server. You will learn how to install all of the components of the Elastic Stack — including Filebeat, a Beat used for forwarding and centralizing logs and files — and configure them to gather and visualize system logs. Additionally, because Kibana is normally only available on the localhost, you will use Nginx to proxy it so it will be accessible over a web browser. At the end of this tutorial, you will have all of these components installed on a single server, referred to as the Elastic Stack server.
Note:
When installing the Elastic Stack, you should use the same version across the entire stack. This tutorial uses the latest versions of each component, which are, at the time of this writing, Elasticsearch 6.5.2, Kibana 6.5.2, Logstash 6.5.2, and Filebeat 6.5.2.
Prerequisites
To complete this tutorial, you will need the following:
- One CentOS 7 server set up by following Initial Server Setup with CentOS 7, including a non-root user with sudo privileges and a firewall. The amount of CPU, RAM, and storage that your Elastic Stack server will require depends on the volume of logs that you intend to gather. For this tutorial, you will be using a VPS with the following specifications for our Elastic Stack server:
- OS: CentOS 7.5
- RAM: 4GB
- CPU: 2
- Java 8 — which is required by Elasticsearch and Logstash — installed on your server. Note that Java 9 is not supported. To install this, follow the "Install OpenJDK 8 JRE" section of our guide on how to install Java on CentOS.
- Nginx installed on your server, which you will configure later in this guide as a reverse proxy for Kibana. Follow our guide on How To Install Nginx on CentOS 7 to set this up.
Additionally, because the Elastic Stack is used to access valuable information about your server that you would not want unauthorized users to access, it's important that you keep your server secure by installing a TLS/SSL certificate. This is optional but strongly encouraged. Because you will ultimately make changes to your Nginx server block over the course of this guide, we suggest putting this security in place by completing the Let's Encrypt on CentOS 7 guide immediately after this tutorial's second step.
If you do plan to configure Let's Encrypt on your server, you will need the following in place before doing so:
A fully qualified domain name (FQDN). This tutorial will use example.com throughout. You can purchase a domain name on Namecheap, get one for free on Freenom, or use the domain registrar of your choice.
- Have to add both of the following DNS records to set up your server.
- An A record with example.com pointing to your server's public IP address.
- An A record with www.example.com pointing to your server's public IP address.
Step 1 — Installing and Configuring Elasticsearch
The Elastic Stack components are not available through the package manager by default, but you can install them with yum by adding Elastic's package repository.
All of the Elastic Stack's packages are signed with the Elasticsearch signing key in order to protect your system from package spoofing. Packages which have been authenticated using the key will be considered trusted by your package manager. In this step, you will import the Elasticsearch public GPG key and add the Elastic repository in order to install Elasticsearch.
Run the following command to download and install the Elasticsearch public signing key:
sudo rpm --import https://artifacts.elastic.co/GPG-KEY-elasticsearch
Next, add the Elastic repository. Use your preferred text editor to create the file elasticsearch.repo in the /etc/yum.repos.d/ directory. Here, we'll use the vi text editor:
sudo vi /etc/yum.repos.d/elasticsearch.repo
To provide yum with the information it needs to download and install the components of the Elastic Stack, enter insert mode by pressing i and add the following lines to the file /etc/yum.repos.d/elasticsearch.repo
[elasticsearch-6.x]
name=Elasticsearch repository for 6.x packages
baseurl=https://artifacts.elastic.co/packages/6.x/yum
gpgcheck=1
gpgkey=https://artifacts.elastic.co/GPG-KEY-elasticsearch
enabled=1
autorefresh=1
type=rpm-md
Here you have included the human-readable name of the repo, the baseurl of the repo's data directory, and the gpgkey required to verify Elastic packages.
When you're finished, press ESC to leave insert mode, then :wq and ENTER to save and exit the file.
With the repo added, you can now install the Elastic Stack. According to the official documentation, you should install Elasticsearch before the other components. Installing in this order ensures that the components each product depends on are correctly in place.
Install Elasticsearch with the following command:
sudo yum install elasticsearch
Once Elasticsearch is finished installing, open its main configuration file, elasticsearch.yml, in your editor:
sudo vi /etc/elasticsearch/elasticsearch.yml
Note: Elasticsearch's configuration file is in YAML format, which means that indentation is very important! Be sure that you do not add any extra spaces as you edit this file.
Elasticsearch listens for traffic from everywhere on port 9200. You will want to restrict outside access to your Elasticsearch instance to prevent outsiders from reading your data or shutting down your Elasticsearch cluster through the REST API. Find the line that specifies network .host, and replace its value with localhost at /etc/elasticsearch/elasticsearch.yml so it looks like this:
. . .
network.host: localhost
. . .
Save and close elasticsearch.yml. Then, start the Elasticsearch service with systemctl:
sudo systemctl start elasticsearch
Next, run the following command to enable Elasticsearch to start up every time your server boots:
sudo systemctl enable elasticsearch
You can test whether your Elasticsearch service is running by sending an HTTP request:
curl -X GET "localhost:9200"
You will see a response showing some basic information about your local node, similar to this:
{
  "name" : "8oSCBFJ",
  "cluster_name" : "elasticsearch",
  "cluster_uuid" : "1Nf9ZymBQaOWKpMRBfisog",
  "version" : {
    "number" : "6.5.2",
    "build_flavor" : "default",
    "build_type" : "rpm",
    "build_hash" : "9434bed",
    "build_date" : "2018-11-29T23:58:20.891072Z",
    "build_snapshot" : false,
    "lucene_version" : "7.5.0",
    "minimum_wire_compatibility_version" : "5.6.0",
    "minimum_index_compatibility_version" : "5.0.0"
  },
  "tagline" : "You Know, for Search"
}
Now that Elasticsearch is up and running, let's install Kibana, the next component of the Elastic Stack.
Step 2 — Installing and Configuring the Kibana Dashboard
According to the installation order in the official documentation, you should install Kibana as the next component after Elasticsearch. After setting Kibana up, we will be able to use its interface to search through and visualize the data that Elasticsearch stores.
Because you already added the Elastic repository in the previous step, you can just install the remaining components of the Elastic Stack using yum:
sudo yum install kibana
Then enable and start the Kibana service:
sudo systemctl enable kibana
sudo systemctl start kibana
Because Kibana is configured to only listen on localhost, we must set up a reverse proxy to allow external access to it. We will use Nginx for this purpose, which should already be installed on your server.
First, use the openssl command to create an administrative Kibana user which you'll use to access the Kibana web interface. As an example, we will name this account kibanaadmin, but to ensure greater security we recommend that you choose a non-standard name for your user that would be difficult to guess.
The following command will create the administrative Kibana user and password, and store them in the htpasswd.users file. You will configure Nginx to require this username and password and read this file momentarily:
echo "kibanaadmin:`openssl passwd -apr1`" | sudo tee -a /etc/nginx/htpasswd.users
Enter and confirm a password at the prompt. Remember or take note of this login, as you will need it to access the Kibana web interface.
Next, we will create an Nginx server block file. As an example, we will refer to this file as example.com.conf, although you may find it helpful to give yours a more descriptive name. For instance, if you have a FQDN and DNS records set up for this server, you could name this file after your FQDN:
sudo vi /etc/nginx/conf.d/example.com.conf
Add the following code block into the file, being sure to update example.com and www.example.com to match your server's FQDN or public IP address. This code configures Nginx to direct your server's HTTP traffic to the Kibana application, which is listening on localhost:5601. Additionally, it configures Nginx to read the htpasswd.users file and require basic authentication.
Note that if you followed the prerequisite Nginx tutorial through to the end, you may have already created this file and populated it with some content. In that case, delete all the existing content in the file before adding the following:
server {
    listen 80;

    server_name example.com www.example.com;

    auth_basic "Restricted Access";
    auth_basic_user_file /etc/nginx/htpasswd.users;

    location / {
        proxy_pass http://localhost:5601;
        proxy_http_version 1.1;
        proxy_set_header Upgrade $http_upgrade;
        proxy_set_header Connection 'upgrade';
        proxy_set_header Host $host;
        proxy_cache_bypass $http_upgrade;
    }
}
When you're finished, save and close the file.
Then check the configuration for syntax errors:
sudo nginx -t
If any errors are reported in your output, go back and double check that the content you placed in your configuration file was added correctly. Once you see syntax is ok in the output, go ahead and restart the Nginx service:
sudo systemctl restart nginx
By default, SELinux security policy is set to be enforced. Run the following command to allow Nginx to access the proxied service:
sudo setsebool httpd_can_network_connect 1 -P
You can learn more about SELinux in the tutorial An Introduction to SELinux on CentOS 7.
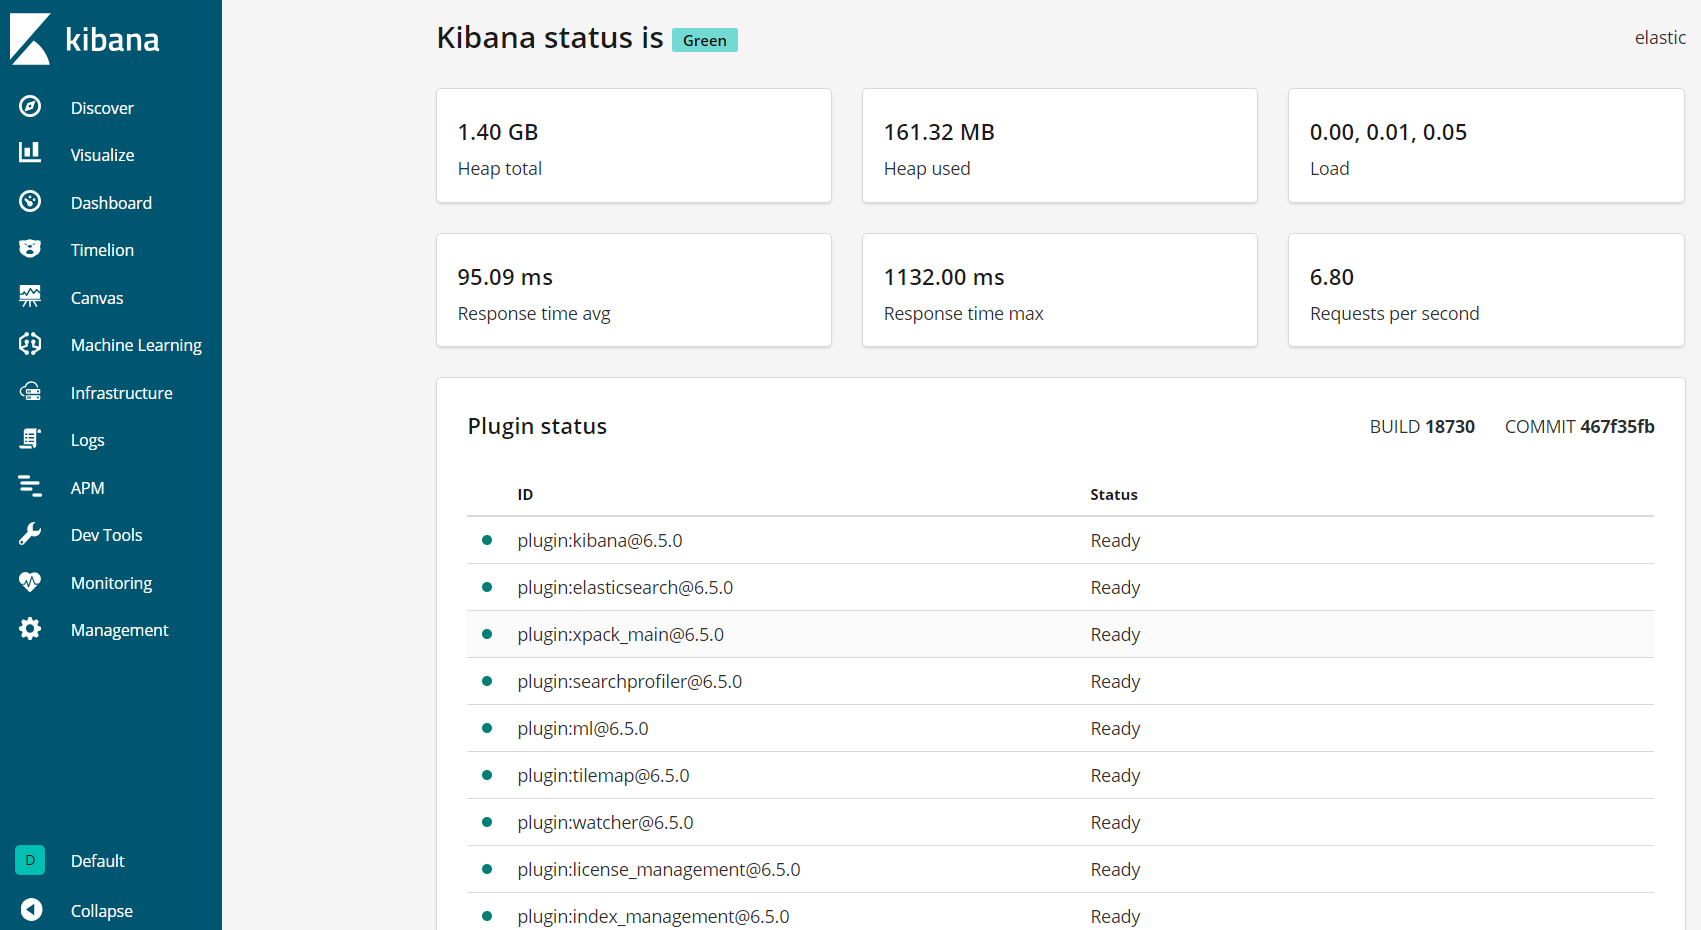
Kibana is now accessible via your FQDN or the public IP address of your Elastic Stack server. You can check the Kibana server's status page by navigating to the following address and entering your login credentials when prompted:
http://your_server_ip/status
This status page displays information about the server’s resource usage and lists the installed plugins.

Note:
As mentioned in the prerequisites section, it is recommended that you enable SSL/TLS on your server. You can follow this tutorial now to obtain a free SSL certificate for Nginx on CentOS 7. After obtaining your SSL/TLS certificates, you can come back and complete this tutorial.
Now that the Kibana dashboard is configured, let's install the next component: Logstash.
Step 3 — Installing and Configuring Logstash
Although it's possible for Beats to send data directly to the Elasticsearch database, we recommend using Logstash to process the data first. This will allow you to collect data from different sources, transform it into a common format, and export it to another database.
Install Logstash with this command:
sudo yum install logstash
After installing Logstash, you can move on to configuring it. Logstash's configuration files are written in the JSON format and reside in the /etc/logstash/conf.d directory. As you configure it, it's helpful to think of Logstash as a pipeline which takes in data at one end, processes it in one way or another, and sends it out to its destination (in this case, the destination being Elasticsearch). A Logstash pipeline has two required elements, input and output, and one optional element, filter. The input plugins consume data from a source, the filter plugins process the data, and the output plugins write the data to a destination.
Create a configuration file called 02-beats-input.conf where you will set up your Filebeat input:
sudo vi /etc/logstash/conf.d/02-beats-input.conf
Insert the following input configuration. This specifies a beats input that will listen on TCP port 5044.
Save and close the file. Next, create a configuration file called 10-syslog-filter.conf, which will add a filter for system logs, also known as syslogs:
sudo vi /etc/logstash/conf.d/10-syslog-filter.conf
Insert the following syslog filter configuration. This example system logs configuration was taken from official Elastic documentation. This filter is used to parse incoming system logs to make them structured and usable by the predefined Kibana dashboards:
Save and close the file when finished.
Lastly, create a configuration file called 30-elasticsearch-output.conf:
sudo vi /etc/logstash/conf.d/30-elasticsearch-output.conf
Insert the following output configuration. This output configures Logstash to store the Beats data in Elasticsearch, which is running at localhost:9200, in an index named after the Beat used. The Beat used in this tutorial is Filebeat:
Save and close the file.
If you want to add filters for other applications that use the Filebeat input, be sure to name the files so they're sorted between the input and the output configuration, meaning that the file names should begin with a two-digit number between 02 and 30.
Test your Logstash configuration with this command:
sudo -u logstash /usr/share/logstash/bin/logstash --path.settings /etc/logstash -t
If there are no syntax errors, your output will display Configruation OK after a few seconds. If you don't see this in your output, check for any errors that appear in your output and update your configuration to correct them.
If your configuration test is successful, start and enable Logstash to put the configuration changes into effect:
sudo systemctl start logstash
sudo systemctl enable logstash
Now that Logstash is running correctly and is fully configured, let's install Filebeat.
Step 4 — Installing and Configuring Filebeat
The Elastic Stack uses several lightweight data shippers called Beats to collect data from various sources and transport them to Logstash or Elasticsearch. Here are the Beats that are currently available from Elastic:
- Filebeat: collects and ships log files.
- Metricbeat: collects metrics from your systems and services.
- Packetbeat: collects and analyzes network data.
- Winlogbeat: collects Windows event logs.
- Auditbeat: collects Linux audit framework data and monitors file integrity.
- Heartbeat: monitors services for their availability with active probing.
In this tutorial, we will use Filebeat to forward local logs to our Elastic Stack.
Install Filebeat using yum:
sudo yum install filebeat
Next, configure Filebeat to connect to Logstash. Here, we will modify the example configuration file that comes with Filebeat.
Open the Filebeat configuration file:
sudo vi /etc/filebeat/filebeat.yml
Note: As with Elasticsearch, Filebeat's configuration file is in YAML format. This means that proper indentation is crucial, so be sure to use the same number of spaces that are indicated in these instructions.
Filebeat supports numerous outputs, but you’ll usually only send events directly to Elasticsearch or to Logstash for additional processing. In this tutorial, we'll use Logstash to perform additional processing on the data collected by Filebeat. Filebeat will not need to send any data directly to Elasticsearch, so let's disable that output. To do so, find the output.elasticsearch section and comment out the following lines by preceding them with a # in /etc/filebeat/filebeat.yml:
#output.elasticsearch:
  # Array of hosts to connect to.
  #hosts: ["localhost:9200"]
...
Then, configure the output.logstash section. Uncomment the lines output.logstash: and hosts: ["localhost:5044"] by removing the #. This will configure Filebeat to connect to Logstash on your Elastic Stack server at port 5044, the port for which we specified a Logstash input earlier:
output.logstash:
  # The Logstash hosts
  hosts: ["localhost:5044"]
Save and close the file.
You can now extend the functionality of Filebeat with Filebeat modules. In this tutorial, you will use the system module, which collects and parses logs created by the system logging service of common Linux distributions.
Let's enable it:
sudo filebeat modules enable system
You can see a list of enabled and disabled modules by running:
sudo filebeat modules list
You will see a list similar to the following:
Output
Enabled:
system

Disabled:
apache2
auditd
elasticsearch
haproxy
icinga
iis
kafka
kibana
logstash
mongodb
mysql
nginx
osquery
postgresql
redis
suricata
traefik
By default, Filebeat is configured to use default paths for the syslog and authorization logs. In the case of this tutorial, you do not need to change anything in the configuration. You can see the parameters of the module in the /etc/filebeat/modules.d/system.yml configuration file.
Next, load the index template into Elasticsearch. An Elasticsearch index is a collection of documents that have similar characteristics. Indexes are identified with a name, which is used to refer to the index when performing various operations within it. The index template will be automatically applied when a new index is created.
To load the template, use the following command:
sudo filebeat setup --template -E output.logstash.enabled=false -E 'output.elasticsearch.hosts=["localhost:9200"]'
This will give the following output:
OutputLoaded index template
Filebeat comes packaged with sample Kibana dashboards that allow you to visualize Filebeat data in Kibana. Before you can use the dashboards, you need to create the index pattern and load the dashboards into Kibana.
As the dashboards load, Filebeat connects to Elasticsearch to check version information. To load dashboards when Logstash is enabled, you need to manually disable the Logstash output and enable Elasticsearch output:
sudo filebeat setup -e -E output.logstash.enabled=false -E output.elasticsearch.hosts=['localhost:9200'] -E setup.kibana.host=localhost:5601
You will see output that looks like this:
Output
. . .
2018-12-05T21:23:33.806Z        INFO    elasticsearch/client.go:163     Elasticsearch url: http://localhost:9200
2018-12-05T21:23:33.811Z        INFO    elasticsearch/client.go:712     Connected to Elasticsearch version 6.5.2
2018-12-05T21:23:33.815Z        INFO    template/load.go:129    Template already exists and will not be overwritten.
Loaded index template
Loading dashboards (Kibana must be running and reachable)
2018-12-05T21:23:33.816Z        INFO    elasticsearch/client.go:163     Elasticsearch url: http://localhost:9200
2018-12-05T21:23:33.819Z        INFO    elasticsearch/client.go:712     Connected to Elasticsearch version 6.5.2
2018-12-05T21:23:33.819Z        INFO    kibana/client.go:118    Kibana url: http://localhost:5601
2018-12-05T21:24:03.981Z        INFO    instance/beat.go:717    Kibana dashboards successfully loaded.
Loaded dashboards
2018-12-05T21:24:03.982Z        INFO    elasticsearch/client.go:163     Elasticsearch url: http://localhost:9200
2018-12-05T21:24:03.984Z        INFO    elasticsearch/client.go:712     Connected to Elasticsearch version 6.5.2
2018-12-05T21:24:03.984Z        INFO    kibana/client.go:118    Kibana url: http://localhost:5601
2018-12-05T21:24:04.043Z        WARN    fileset/modules.go:388  X-Pack Machine Learning is not enabled
2018-12-05T21:24:04.080Z        WARN    fileset/modules.go:388  X-Pack Machine Learning is not enabled
Loaded machine learning job configurations
Now you can start and enable Filebeat:
sudo systemctl start filebeat
sudo systemctl enable filebeat
If you've set up your Elastic Stack correctly, Filebeat will begin shipping your syslog and authorization logs to Logstash, which will then load that data into Elasticsearch.
To verify that Elasticsearch is indeed receiving this data, query the Filebeat index with this command:
curl -X GET 'http://localhost:9200/filebeat-*/_search?pretty'
You will see an output that looks similar to this:
Output
{
  "took" : 1,
  "timed_out" : false,
  "_shards" : {
    "total" : 3,
    "successful" : 3,
    "skipped" : 0,
    "failed" : 0
  },
  "hits" : {
    "total" : 3225,
    "max_score" : 1.0,
    "hits" : [
      {
        "_index" : "filebeat-6.5.2-2018.12.05",
        "_type" : "doc",
        "_id" : "vf5GgGcB_g3p-PRo_QOw",
        "_score" : 1.0,
        "_source" : {
          "@timestamp" : "2018-12-05T19:00:34.000Z",
          "source" : "/var/log/secure",
          "meta" : {
            "cloud" : {
. . .
If your output shows 0 total hits, Elasticsearch is not loading any logs under the index you searched for, and you will need to review your setup for errors. If you received the expected output, continue to the next step, in which you'll become familiar with some of Kibana's dashboards.
Step 5 — Exploring Kibana Dashboards
Let's look at Kibana, the web interface that we installed earlier.
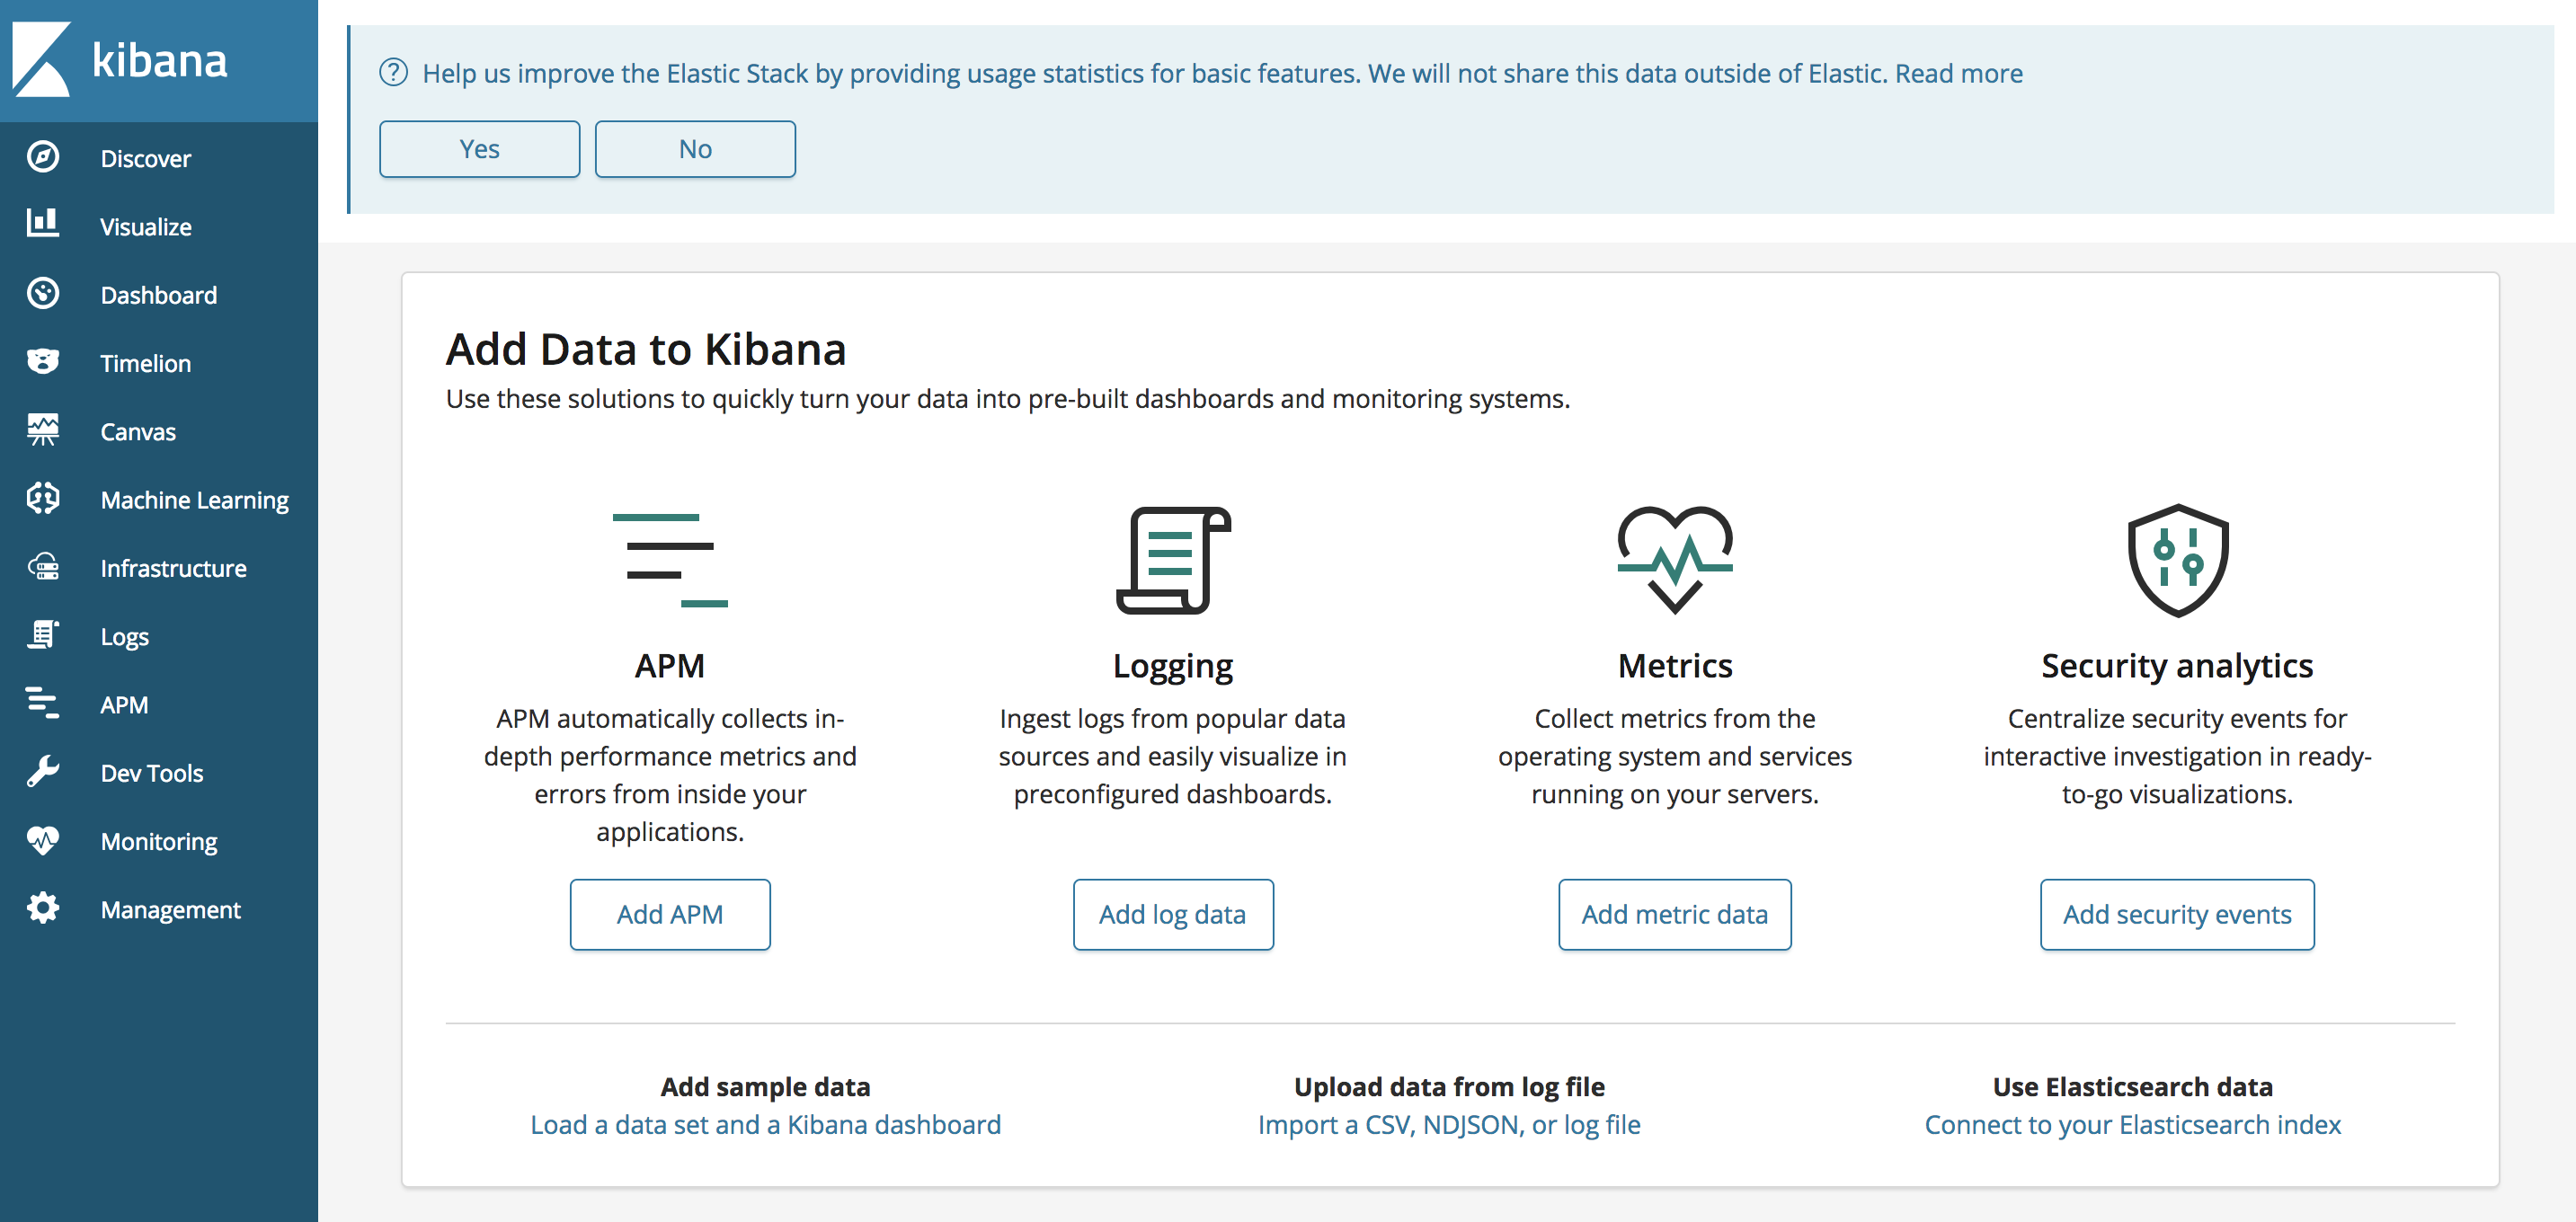
In a web browser, go to the FQDN or public IP address of your Elastic Stack server. After entering the login credentials you defined in Step 2, you will see the Kibana homepage:

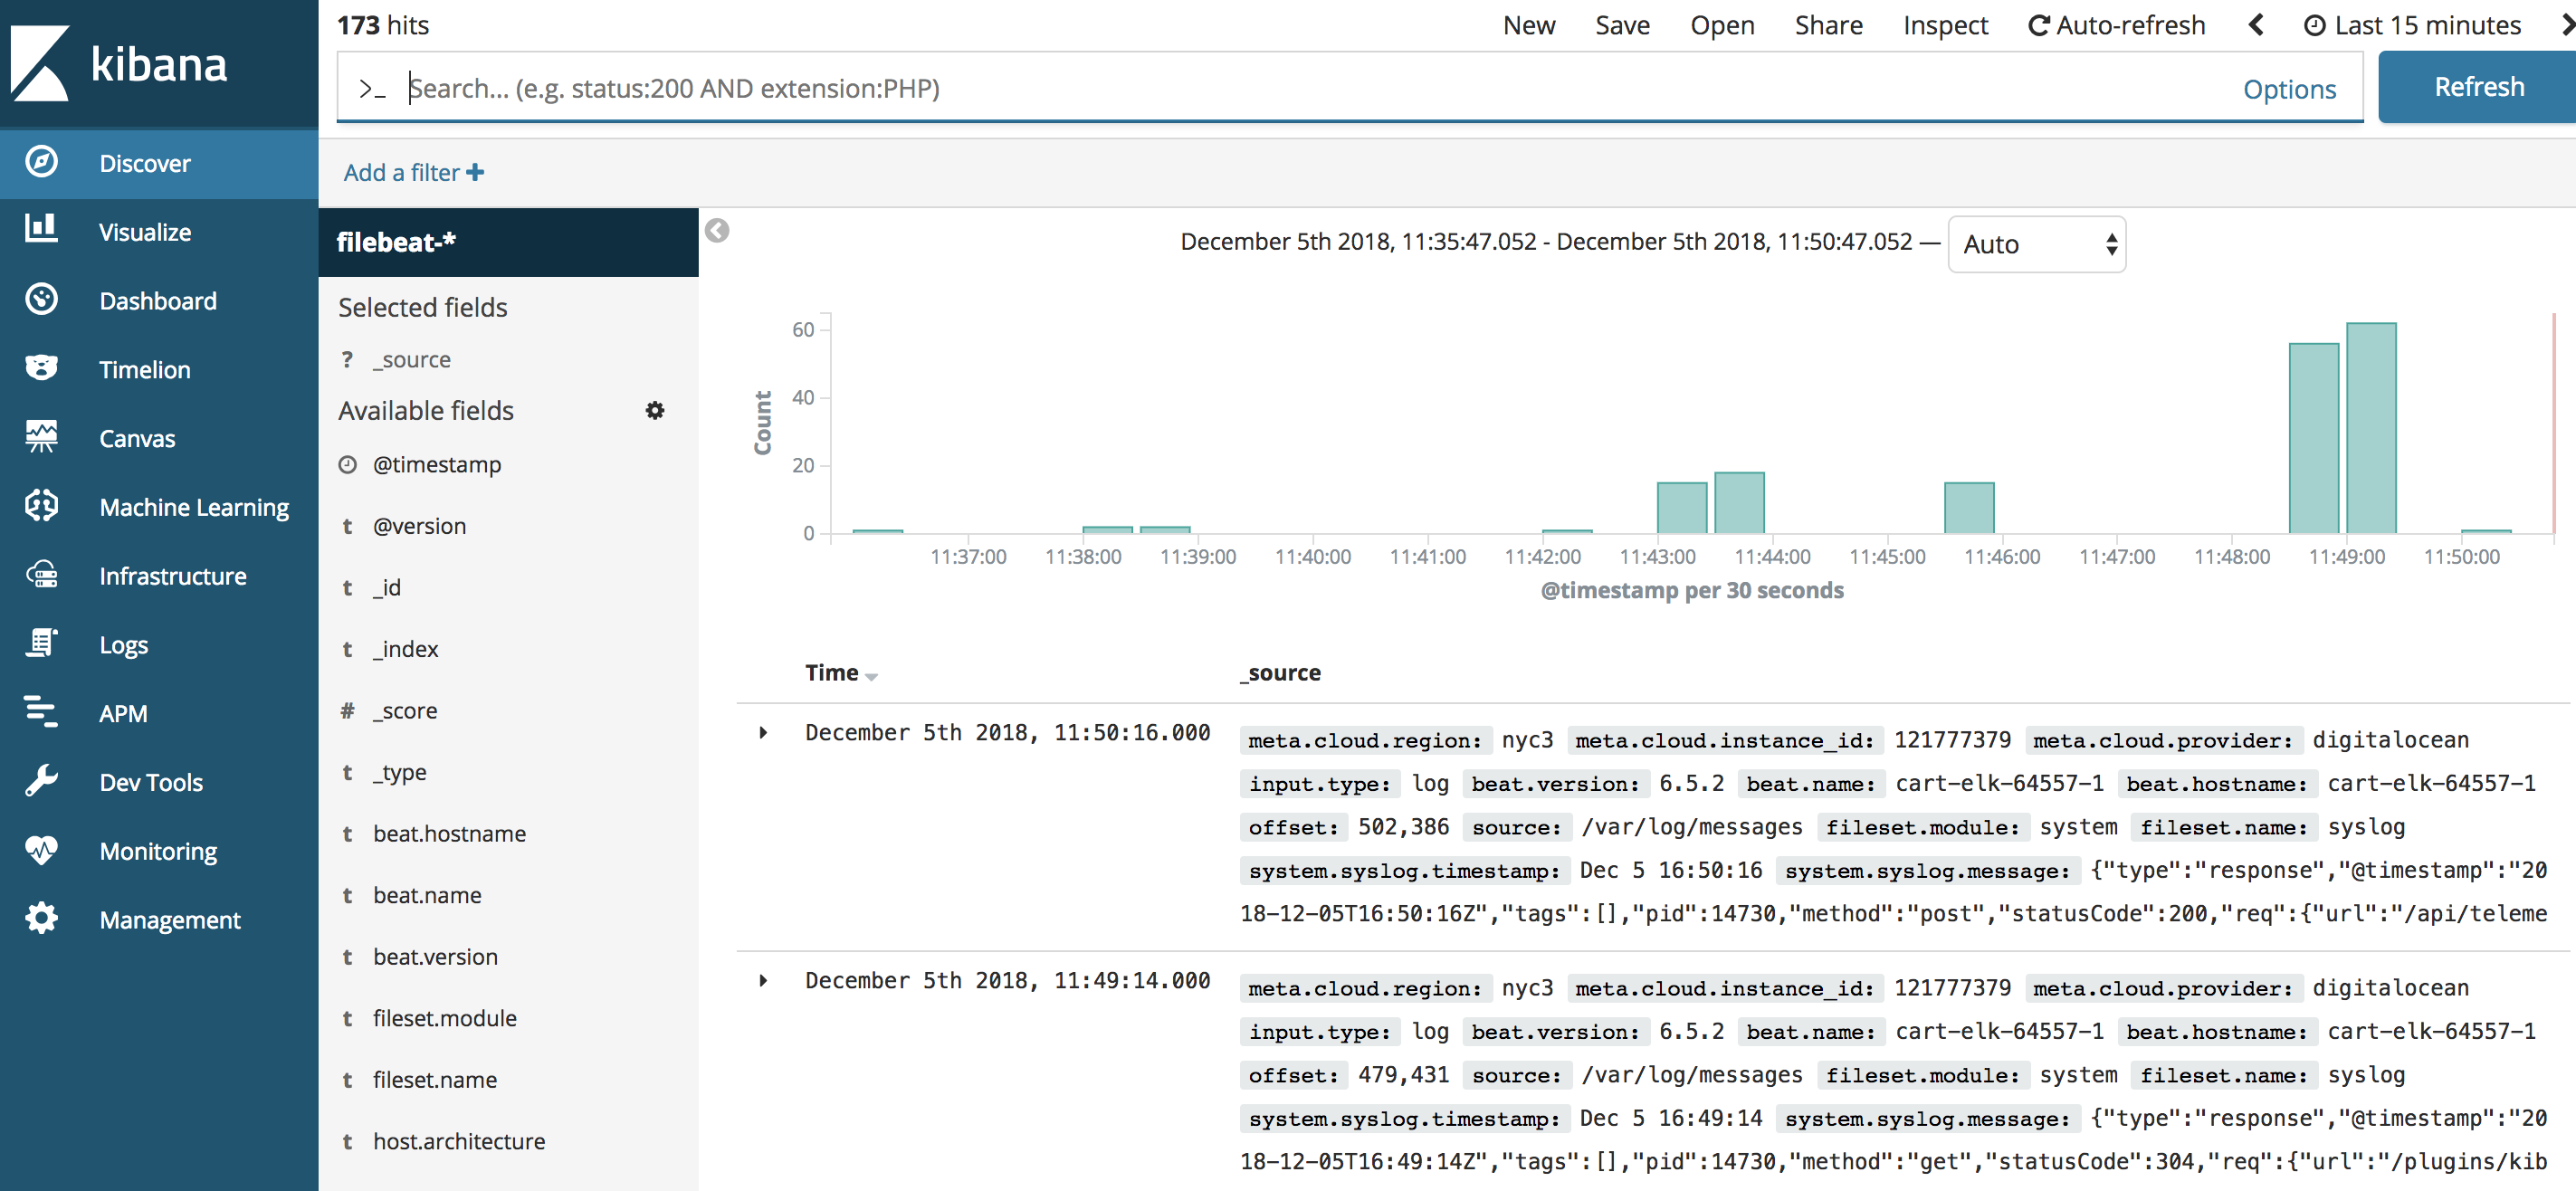
Click the Discover link in the left-hand navigation bar. On the Discover page, select the predefined filebeat-* index pattern to see Filebeat data. By default, this will show you all of the log data over the last 15 minutes. You will see a histogram with log events, and some log messages below:

Here, you can search and browse through your logs and also customize your dashboard. At this point, though, there won't be much in there because you are only gathering syslogs from your Elastic Stack server.
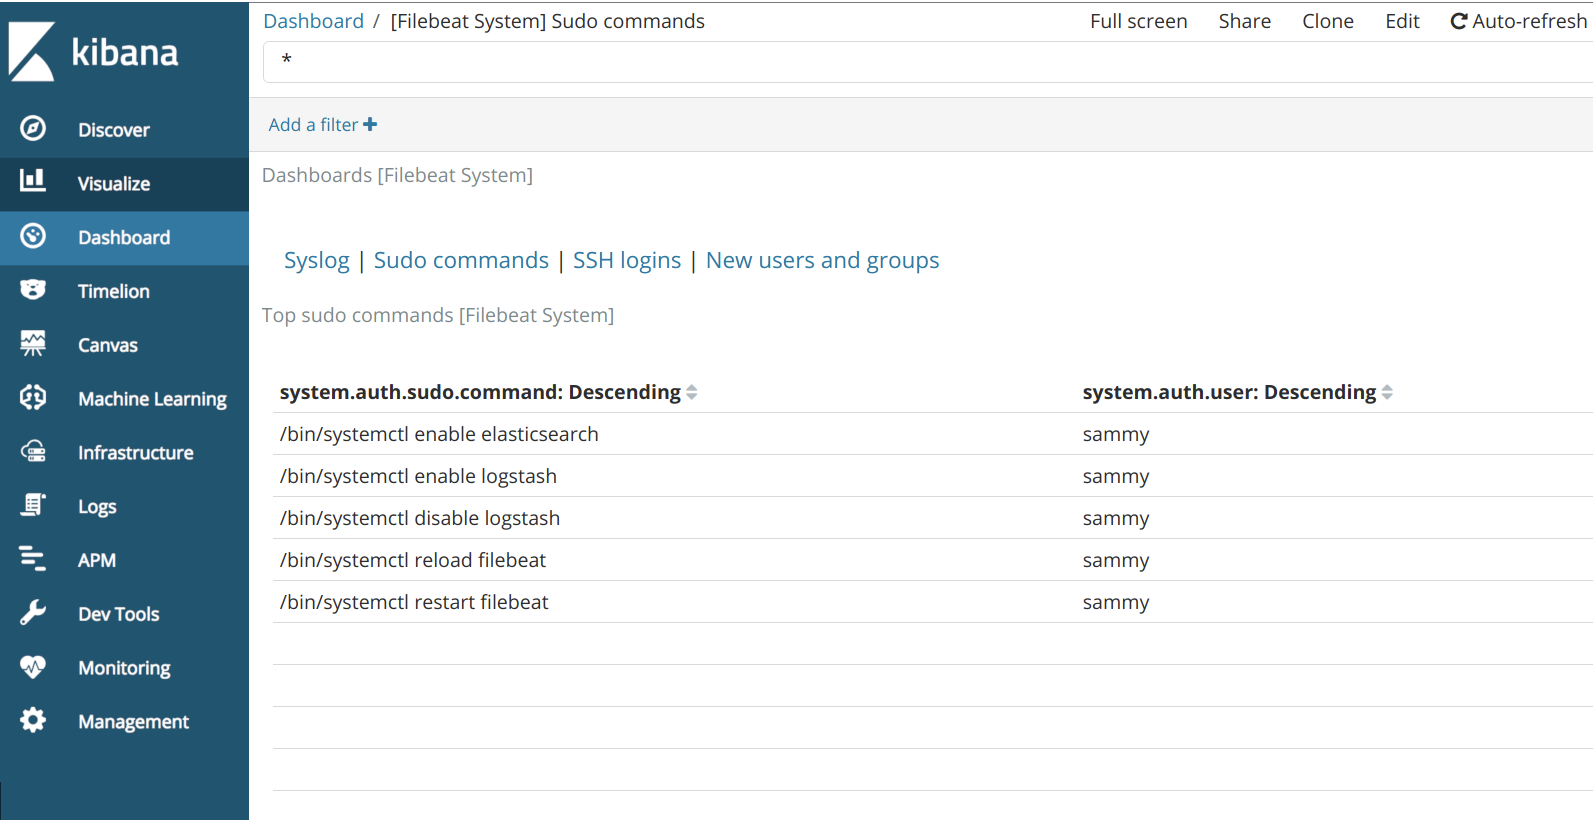
Use the left-hand panel to navigate to the Dashboard page and search for the Filebeat System dashboards. Once there, you can search for the sample dashboards that come with Filebeat's system module.
For example, you can view detailed stats based on your syslog messages:

You can also view which users have used the sudo command and when:

Kibana has many other features, such as graphing and filtering, so feel free to explore.
Conclusion
In this tutorial, you installed and configured the Elastic Stack to collect and analyze system logs. Remember that you can send just about any type of log or indexed data to Logstash using Beats, but the data becomes even more useful if it is parsed and structured with a Logstash filter, as this transforms the data into a consistent format that can be read easily by Elasticsearch.


