You need a Java Runtime Environment (JRE) because Elasticsearch is developed in Java programming language, you can install OpenJDK package that includes JRE.
Install Java
yum install java-1.8.0-openjdk.x86_64To check your Java version execute:
java -versionDownload and install Elasticsearch
We are going to download Elasticsearch as an RPM package:
wget https://artifacts.elastic.co/downloads/elasticsearch/elasticsearch-5.0.0.rpmThen install the RPM package that you just downloaded:
rpm -ivh elasticsearch-5.0.0.rpmExecute the following commands to enable and start your Elasticsearch service:
systemctl enable elasticsearchsystemctl start elasticsearch
Check your Elasticsearch service status with the command below:
systemctl status elasticsearchIf you are trying to start Elasticsearch on a server with less than 2GB memory you can change some parameters to make it work:
First switch to the following path:
cd /etc/elasticsearch/Open the following file with your text editor:
nano jvm.optionsand find the lines that refer to:
-Xms2g
-Xmx2g
Then change them to:
-Xms1g
-Xmx1g
Or you can even use smaller parameters like “Mega Bytes” e.g. “Xms512m” and “Xmx512m”:
Then restart your Elasticsearch service to take effect:
systemctl restart elasticsearchTesting Elasticsearch
You can test if your Elasticsearch is working fine with the command below:
curl localhost:9200You should get the following output:
{
"name" : "HugeServer",
"cluster_name" : "elasticsearch",
"cluster_uuid" : "k27ZZFJPTaOtwg6_pyzEiw",
"version" : {
"number" : "5.5.0",
"build_hash" : "2cfe0df",
"build_date" : "2017-05-29T16:05:51.443Z",
"build_snapshot" : false,
"lucene_version" : "6.5.1"
},
"tagline" : "You Know, for Search"
}
Kibana
Kibana is an open source data visualization plugin for Elasticsearch. It provides visualization capabilities on top of the content indexed on an Elasticsearch cluster. Users can create bar, line and scatter plots, or pie charts and maps on top of large volumes of data.Setting up Kibana is very simple, you can easily install it using an RPM package:
wget https://artifacts.elastic.co/downloads/kibana/kibana-5.5.0-x86_64.rpmNow just execute the following command so you can start the Kibana service:
systemctl daemon-reloadsystemctl start kibana
For accessing the web interface you should do some configuration to make your Kibana run on the preferred port (the default and recommended port is 5601):
nano /etc/kibana/kibana.ymlFind the line that refers to “server.port” and uncomment it.
Then save and exit.
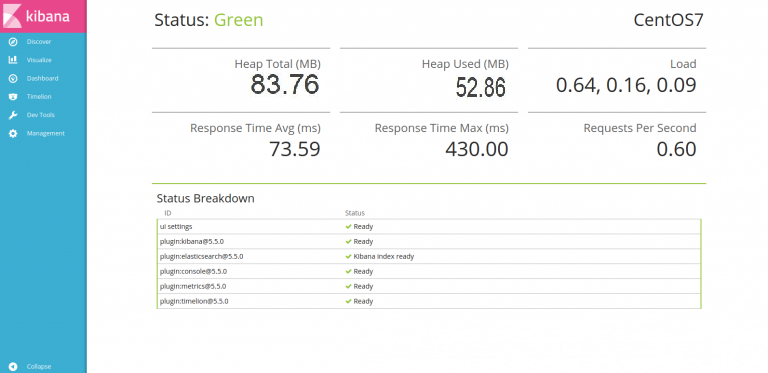
Now you can open your browser and see your Kibana panel at the following address:
http://localhost:5601You will see a page like below:
Securing the Kibana
As you saw, Kibana has no security or authentication, so if you keep it listen on localhost it may be Ok but what if you want to get access to it over the internet?In this section, we are going to secure Kibana with Nginx using basic web authentication.
Installing Nginx
For installing Nginx you have to add “EPEL” repository first:
yum install epel-releaseNow you can install Nginx using the command below:
yum install nginxAfter the installation is finished, execute the following commands to start your Nginx service and make it run at startup:
systemctl start nginxsystemctl enable nginx
Install and Configure .htpasswd
We are going to need the “.htpasswd” for managing our web base passwords. you can install it with “httpd-tools” package:
yum install httpd-toolsMake a .htpasswd file with username and password with the command below (replace the red part with your preferred credentials):
htpasswd -c /etc/nginx usernameYou can see your encrypted password with the command below:
nano /etc/nginx/.htpasswdConfiguring Nginx
Now we will configure Nginx to pass authorized users to the “localhost:5601”
Open the Nginx configuration file with your text editor:
nano /etc/nginx/nginx.confFind the “server” directive and change it like below:
server {
  listen *:80;
  server_name _;
  location / {
    proxy_pass http://localhost:5601;
    auth_basic "Restricted";
    auth_basic_user_file /etc/nginx/.htpasswd;
  }
}
Save and exit.
Check the Nginx configuration with the command below:
nginx -tYou should get the following output:
nginx: the configuration file /etc/nginx/nginx.conf syntax is ok
nginx: configuration file /etc/nginx/nginx.conf test is successful
Restart the Nginx service to take effect:
systemctl restart nginxOpen the browser on any other station and see your public IP address through it, you will prompt for authentication and then you will be direct to the Kibana control panel.


